“During the first five months of this year, activity at the port of Giurgiulești followed a ‘ramp-up—peak—pause’ pattern: steady growth in February and March, a peak in April, and a noticeable but not catastrophic decline in May,” notes agromarketing expert Yuri Riza. “This pattern is more indicative of a seasonal cycle—specifically, the periodic shipment of carryover stocks from last year’s agricultural harvest—than of a structural change in demand for maritime freight transport. It is logical to assume that during the summer months, cargo turnover may return to the levels seen during the busiest spring months. Of course, this is assuming that market conditions for grain in the region remain favorable—that is, prices remain at their current relatively high levels.”
At the level of the “commodity basket” for the port of Giurgiulești, there is a very high degree of differentiation between exports and imports.
Nearly 90% of the cargo exported through the port consists of three commodity categories: wheat, sunflower seeds, and corn.
In contrast, imports are distributed more or less evenly across a fairly long list of goods: gravel, diesel fuel, and mineral fertilizers—a total of nearly a dozen major commodity categories.
The “two-way flow” of sunflower seed exports and imports deserves special attention, as it “suggests” a well-developed processing industry and re-export through the port’s free zone.
In terms of the geography of shipments, the main characteristic of the period under review was the “asymmetry of roles” among the largest trading partners of the port of Giurgiulești.
Thus, Turkey is the most important buyer of Moldovan grain and oilseeds.
Russia appears in the port’s cargo transshipment statistics exclusively as a supplier of imported goods (in particular, fertilizers).
Meanwhile, Romania—though not the leading exporter or importer of any specific commodity—turns out to be the complex’s largest partner overall.
This role appears particularly symbolic in light of the April deal, under which management of the international port of Giurgiulești was transferred to the Romanian state-owned company that oversees the ports of Constanța.
In terms of market structure, the complex is clearly divided into two functionally distinct segments.
The first is the Giurgiulești International Free Port, a versatile, relatively deep-water terminal with its own niche in the transportation of liquid bulk cargo and a dominant role in the transshipment of oilseeds.
The second is the Passenger and Cargo Port, a niche river terminal specializing in grain, non-metallic materials, and a small group of other goods that pass exclusively through it.
This functional specialization appears to have stabilized and will continue to determine the nature of cargo flows regardless of monthly fluctuations and total transshipment volumes.
Cargo Turnover Trends at the Giurgiulești Port Complex by Month, Direction of Traffic, and Port, January–May 2026
| Cargo Turnover of the “Giurgiulești Port Complex” |
January |
February | March | April | May |
Entire period |
| Giurgiulești International Free Port, metric tons |
153,587 |
200,148 | 219,487 | 256,797 | 206,971 |
1,036,989 |
| Exports |
90,456 |
121,064 | 105,408 | 128,019 | 107,328 |
552,275 |
| Imports |
63,131 |
79,084 | 114,078 | 128,777 | 99,644 |
484,715 |
| Giurgiulești Passenger and Cargo Port, metric tons |
48,143 |
67,579 | 118,124 | 82,412 | 66,178 |
382,436 |
| Exports |
24,554 |
25,755 | 62,167 | 43,489 | 38,354 |
194,319 |
| Imports |
23,589 |
41,824 | 55,957 | 38,923 | 27,823 |
188,117 |
| Total cargo turnover, metric tons |
201,730 |
267,727 | 337,611 | 339,209 | 273,149 |
1,419,426 |
Ratio of Exports to Imports in the Port Complex’s Total Cargo Turnover, January–May 2026
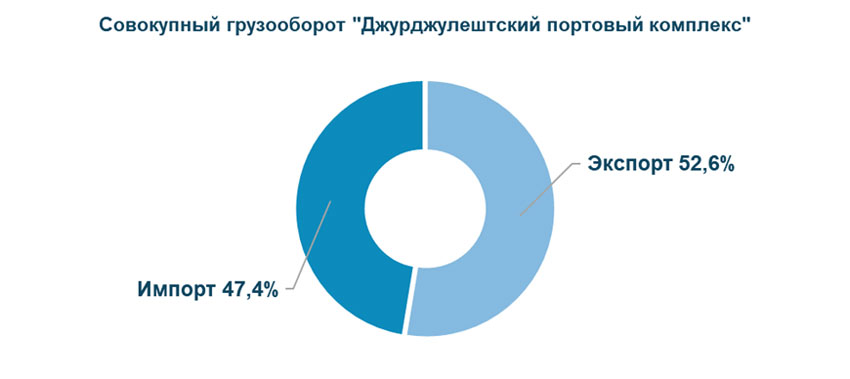
Total cargo turnover at the port of Giurgiulești
Structure of cargo turnover at the Giurgiulești port complex by cargo type, January–May 2026
|
Cargo, metric tons |
Exports | Imports | Total cargo turnover |
Cargo Turnover Breakdown |
| Wheat |
342,265 |
0 | 342,265 |
24.11% |
| Sunflower seeds |
204,157 |
56,638 | 260,794 |
18.37% |
| Gravel |
0 |
179,366 | 179,366 |
12.64% |
| Corn |
126,023 |
0 | 126,023 |
8.88% |
| Diesel fuel |
350 |
124,979 | 125,329 |
8.83% |
| Mineral fertilizers |
0 |
119,891 |
119,891 |
8.45% |
| Gasoline |
0 |
50,087 | 50,087 |
3.53% |
| Coal |
0 |
48,906 | 48,906 |
3.45% |
| Table salt |
0 |
44,059 | 44,059 |
3.10% |
| Vegetable oil |
23,064 |
0 | 23,064 |
1.62% |
| Metal products |
0 |
22,355 | 22,355 |
1.57% |
| Ferrous scrap | 19,196 | 1,436 | 20,632 | 1.45% |
| Coal coke | 0 | 18,799 | 18,799 | 1.32% |
| Sunflower meal | 16,880 | 0 | 16,880 | 1.19% |
| Dried distillers’ grains | 8,520 | 0 | 8,520 | 0.60% |
| Soda ash | 0 | 6,318 | 6,318 | 0.45% |
| Barley | 2,565 | 0 | 2,565 | 0.18% |
| Livestock | 2,261 | 0 | 2,261 | 0.16% |
| Rapeseed | 1,223 | 0 | 1,223 | 0.09% |
| Grain crops | 90 | 0 | 90 | 0.01% |
| Total cargo volume, metric tons | 746,594 | 672,832 | 1,419,426 | 100% |
Follow our updates