At the same time, however, the volume of grain exports increased—both in physical terms (+7%) and in value terms (8.9%).
Total grain exports from Moldova in May amounted to 176,000 metric tons, worth 700.2 million lei (compared to 164,600 metric tons and 643.2 million lei the previous month).
Wheat: A Slipping Lead
Wheat remained the leader of the “export basket,” but its position has noticeably weakened. Last month, the country shipped nearly 116,000 metric tons of this product to foreign markets (accounting for nearly 66% of the grain trade by volume and 65% by value). Compared to the previous month, both shares declined by approximately 12%.
However, export revenue fell slightly less than physical exports. This was due to a small but noticeable increase in the average export price of wheat—from 3,853 lei/t to 3,943 lei/t (+2.3%). The market appears to have begun supporting the flow of export goods by raising purchase prices amid a shrinking supply of produce from agricultural producers (as well as, possibly, price increases in contracts with end buyers).
Table — Wheat Exports from Moldova in May 2026 by Importing Country
|
Wheat Exports by Country |
Weight, metric tons | Value, lei | Total for field Average price per metric ton in lei | Export structure by weight, % |
Export structure by value, % |
| Italy |
49,240 |
199,157,106 | 4,045 | 42.50% |
43.59% |
| Romania |
35,084 |
131,832,389 | 3,758 | 30.28% |
28.85% |
| Turkey |
13,685 |
53,600,449 | 3,917 | 11.81% |
11.73% |
| Greece |
13,574 |
55,207,865 | 4,067 | 11.71% |
12.08% |
| Malaysia |
4,283 |
17,100,554 | 3,992 | 3.70% |
3.74% |
| Total wheat exports |
115,867 |
456,898,362 | 100% | 100% |
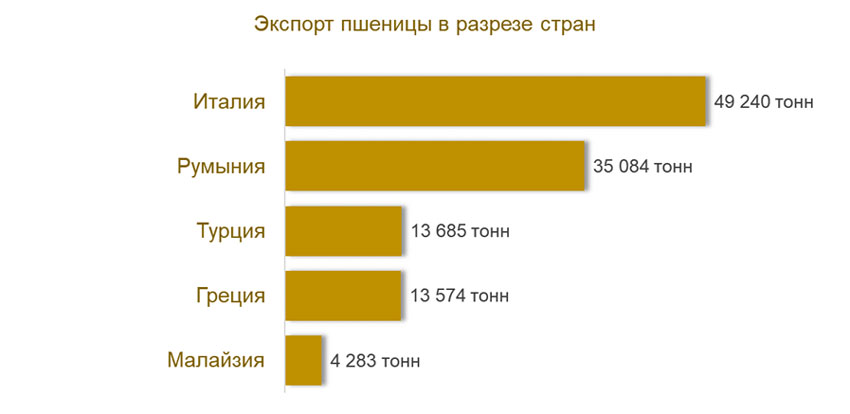
Wheat exports by country
Corn – On the Rise
The volume of physical exports of Moldovan corn in May of this year increased by nearly 75% compared to the previous month, reaching 59,9 thousand metric tons. At the same time, revenue from exports of this product for the month rose by 72%—to 242.1 million lei.
Corn’s share of the “export basket” for the month rose in physical terms from 21% to 34% and in value terms from 22% to 35%.
“This isn’t just ‘static on the air,’ but a sharp reversal of the trend: as recently as April, the crop was considered an off-season leftover, but in May it became the main driver of growth for total grain exports,” says Iurie Rija, an expert in agromarketing. “Interestingly, the average price of corn actually fell slightly—from 4,104 lei/metric ton to 4,045 lei/metric ton (-1.4%). And the price gap between corn and wheat narrowed from 251 to 102 lei/metric ton. In other words, the two leading crops traded at virtually comparable prices in May—an atypical occurrence compared to previous months, when corn consistently “commanded a premium” of around 250 lei.
Table – Corn Exports from Moldova in May 2026 by Importing Country
|
Corn exports by country |
Weight, metric tons | Value, lei | Total for field Average price per metric ton, lei | Export structure by weight, % |
Export structure by value, % |
| Greece |
21,591 |
88,646,293 | 4,106 | 36.11% |
36.86% |
| Italy |
13,418 |
52,804,598 | 3,935 | 22.44% |
21.95% |
| Turkey |
7,008 |
27,391,874 | 3,909 | 11.72% |
11.39% |
| United Kingdom |
6,077 |
20,921,637 | 3,443 | 10.16% |
8.70% |
| Albania |
6,018 |
26,549,958 | 4,412 | 10.07% |
11.04% |
| Bulgaria |
4,400 |
18,564,732 | 4,219 | 7.36% |
7.72% |
| Netherlands |
621 |
2,575,094 | 4,147 | 1.04% |
1.07% |
| Romania |
493 |
1,842,113 | 3,739 | 0.82% |
0.77% |
| Poland |
115 |
940,585 | 8,179 | 0.19% |
0.39% |
| Iraq |
24 |
148,183 | 6,174 | 0.04% |
0.06% |
| Syria |
22 |
133,108 | 6,050 | 0.04% |
0.06% |
| Total corn exports |
59,787 |
240,518,176 | 100% |
100% |
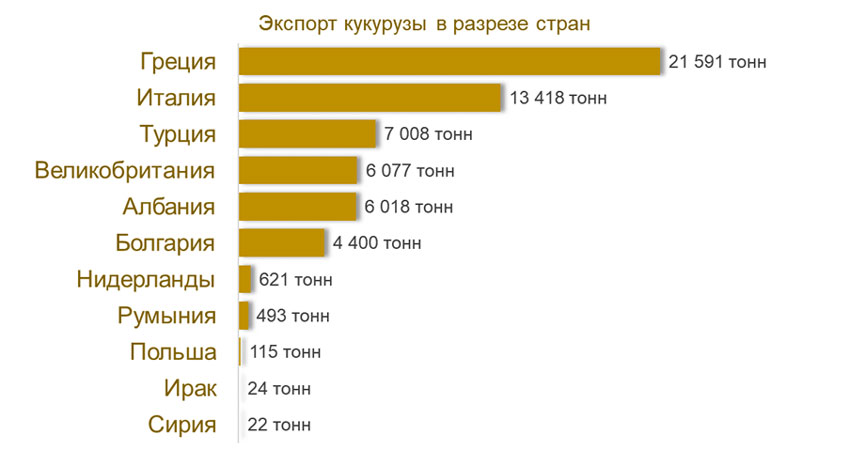
Corn exports by country
Geography of Moldova’s grain exports in May
In May, Moldovan wheat was shipped to only five countries (compared to eight in April). This is entirely consistent with the general pattern of grain exports “at the end of the season.” “Peripheral destinations and one-off shipments have disappeared; the main flow has concentrated on trusted partners,” explains Iurie Rija.
The main “event of the month” in the wheat segment was a change in the leader of the “buyer hierarchy.” Italy took first place in the ranking—49.2 thousand metric tons (a 42.5% share by volume and a 43.6% share by value, representing increases of 49% and 26%, respectively, compared to the previous month).
Romania, which had previously dominated for two months, slipped to second place: 35.1 thousand metric tons (a 30.28% share, representing a 41% decline in physical volume and a 16% decline in value).
This reshuffling of the leaders is not a one-month fluke but a continuation of a trend that began back in April. As the season draws to a close, wheat shipments are heading to more distant and, at the same time, premium markets (with rare exceptions). Export contract prices confirm this logic: wheat destined for Italy traded at 4,045 lei/t, while that for Romania traded at 3,758 lei/t, a difference of 287 lei/t (7.6%). At the same time, Italy traditionally imposes higher quality requirements on grain, and seasonality does not affect this.
Turkey and Greece share third and fourth place with similar volumes—13.7 and 13.6 thousand metric tons, respectively, accounting for 11.81% and 11.71% of the total. Greece, however, pays the highest price for Moldovan wheat—4,067 lei/t. Malaysia rounds out the top five with 4.3 thousand metric tons (average shipment price: 3,992 lei/t). Moreover, exports to Malaysia have been growing month over month, indicating a strengthening of market positions rather than a random pattern (one-off shipments).
Overall, the May wheat export pattern is typical for a crop with a long storage cycle, where the bulk of shipments follow established logistics corridors, while peripheral destinations play a supporting role.
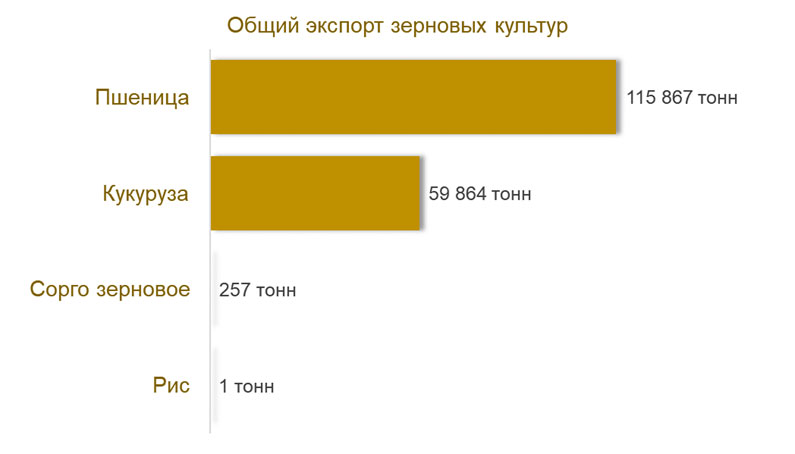
Total grain exports
Corn was shipped to11 countries
The top news of the month in this segment of the grain export market is the absence of Lebanon from the list of buyers. Previously (this past spring), the country accounted for 40–50% of corn shipments from Moldova.
Several European countries immediately filled the resulting gap. Greece took the top spot with 21.6 thousand metric tons (a 36% share by volume and 37% by value). Italy made an even more dramatic leap—from 2,300 to 13,400 metric tons (+473%), rising from fifth to second place (22.44% in physical terms). Turkey took third place in the ranking with 7,000 metric tons (11.72%). This leap from the bottom of the buyer list to the top three is not a statistical fluke but a sign that the Turkish market has reopened to Moldovan corn—practically “from scratch.”
Unlike the wheat segment, Moldova’s corn export market in May showed differentiation rather than concentration. Instead of a single dominant buyer, three players set the tone in this market segment. “Reducing dependence on a single buyer is a positive sign of export stability, even if it was a direct consequence of the largest client’s exit from the market,” concludes Iurie Rija.
Market Operators
Exports of May wheat were handled by 29 Moldovan companies (31 in April). The May corn market was served by 17 Moldovan companies—more than in April (14 companies)—which logically corresponds to a three-quarters increase in volume. The market leader in both segments is Rusagro-Prim SRL (in the wheat segment, its physical and value shares are 29% and 30%, respectively; in the corn segment, they are nearly 42% and 43%, respectively).
Follow our updates