
The English Premier League has the largest share of the global transfer market // Photo: sportsbusinessjournal.com
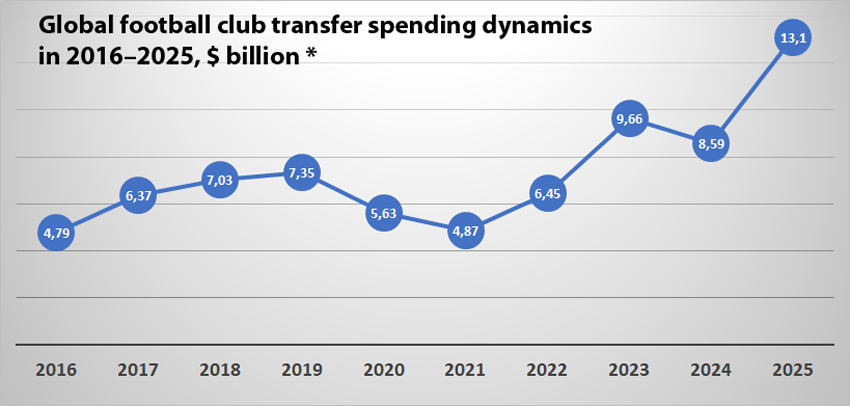
The market decline occurred in 2020-2021 – during the COVID-19 pandemic, when most national championships were suspended or held in an abbreviated format(see graph below).
Europe accounted for more than 80% of global transfer spending in 2025, according to a report by Federation Internationale de Football Association (FIFA). Thus, out of $13.08 billion, clubs in the Union of European Football Associations (UEFA) zone spent $10.72 billion. This amount is more than 50% higher than the one recorded at the end of 2024 – $6.96 billion.
The leadership in the world is held by English clubs, which spent $3.82 billion on the acquisition of new players. In second place is Germany – the clubs of the first Bundesliga and other German leagues cumulatively spent $1.28 billion. The top three is rounded off by Italy, whose clubs allocated for this purpose $1.2 billion.
In the ranking of confederations next to the European clubs are Asian clubs, which spent $1.21 billion, or 9.3% of the global figure. Clubs from Saudi Arabia were the most active, accounting for almost 3/4 of the Asian spending ($906.9 million). Two other countries located on the Arabian Peninsula – Qatar ($128.9 million) and the UAE ($106.6 million) – were also in the top three.
South America (CONMEBOL) ranked third among the confederations. Clubs from this continent spent $346.2 million. Clubs from North, Central America and the Caribbean (CONCACAF) spent slightly less, with $326.2 million on transfers in 2025. African countries (CAF) accounted for less than 0.2% of the world total – just $24.9 million. Data for Oceania (OFC) is not shown.
Clubs from UEFA zone countries were also the biggest beneficiaries of transfer payments. For the year, they earned $11.24 billion from the sale of players. English clubs retained the leadership ($1.77 billion), France took second place ($1.71 billion), Germany closed the top three ($1.49 billion). Clubs from Italy and Spain ranked fourth and fifth, earning $1.1 billion and $929.1 million respectively. For comparison, clubs from South America, which ranked second among the confederations, collectively earned a little more than Italy – $1.11 billion.
Stars for millions and “workhorses” at a similar price
Three of the world’s most expensive international transfers took place in the English championship. “Liverpool” paid € 125 million for the transfer of Florian Wirtz from “Bayer 04” (Germany) and € 95 million – for Hugo Ekitike, who left German “Eintracht”. Manchester United’s acquisition of Benjamin Szeszko from RB Leipzig (Germany) for €76.5 million was the third most expensive. The transfer of Aleksander Isak from Newcastle to Liverpool for €145 million was not taken into account by FIFA as it was done within the same association.
More than 5,200 professional men’s soccer clubs around the world were involved in 24,500 transfers last year. The number of transactions broke the record set the year before, when 7.7% fewer transfers were made. Despite the fact that the majority of player transfers are still non-commissioned, the share of commissioned transfers rose to a record 17.7%.
In total, clubs from 135 soccer associations involved in fee-paying transactions were involved in transfers (not including transactions when a player moves to a new club as a free agent – author’s note). Of these, 106 associations, or 78.5% made a net profit. This figure is higher than a year earlier, when net profit was recorded in 72.7% of associations. At the same time, in 29 associations, clubs received fees for outgoing transfers but did not incur expenses for incoming transfers. In five associations, the opposite situation was observed – a number of clubs spent money on the acquisition of players, but earned nothing on sales.
The majority of transfers made in 2025 had a transaction value of less than $500k. Although they were more than 55% of the total, they accounted for just 2.9% of total transfer spending. More than half of global spending came from deals worth more than $20 million, although they accounted for just 3.8% of the global total.
The vast majority of transfer fees were paid in fixed sums – an average of $10.88 billion, which accounted for 83.1% of total deal value. Contractually agreed fees totaled about $2.1 billion, or 16.1% of the total. The remaining 0.8% was used to activate the “buy-back” option for players from former clubs.
More than 60% of the total number of transfers are related to players whose contract has expired. They move to a new club as a free agent, and the former club is left with no profit. This practice is widely used in many small soccer countries, including Moldova.
The average duration of a contract in international transfers of soccer players last year was 19.5 months. However, this figure varies greatly – from less than six months (16.1% of the total number of contracts) to more than four years (4.9%). More than 60% of professional contracts were for between six months and two years.
* According to FIFA Global Transfer Report


