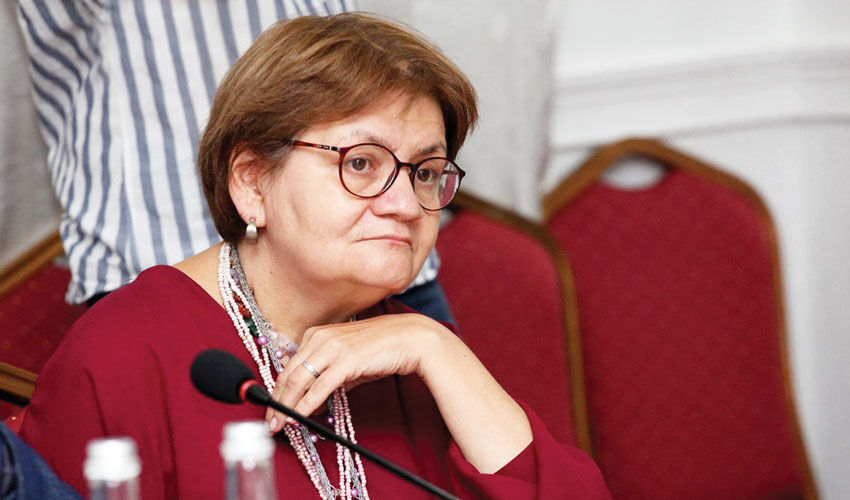
Galina Shelar
But our neighbors are not richer either – Moldova is not only at the end of the rankings in terms of GDP and PPP of European countries, but also geographically located in the poorest region of Europe.
It should be noted that nominal GDP is calculated in US dollars ($), while PPP GDP is measured in international dollars (Int$) – a conventional currency that shows how many goods and services can be bought in different countries for the same amount of money. Theoretically, if the salary in Moldova is 2.5-3 times lower than in the USA, it allows for the same lifestyle.
But in practice it is far from always so. The average salary in Moldova in 2025 is expected to be just under $1,000, while in the U.S. last year the average income per person was already $60,000 per year or $5,000 per month.
According to IMF calculations, Moldova ranks 37th on the continent (out of 41) in nominal GDP and 36th in purchasing power parity. At the same time, it belongs to the Eastern Europe region.
North Macedonia, Montenegro, Andorra and San Marino, with a population of 33,627 people and a GDP of $2 billion, are below Moldova in nominal GDP.
Moldova’s geographical neighbors have the following indicators: Romania with a nominal GDP of $403.4 billion is in 16th place, and with Int$ 926.8 is in 9th position. Ukraine has $205.7 billion (22nd place) GDP and $690.1 billion Int$ (14th place). Russia is in 5th place at par with $2.1 trillion, and in first place with Int$ 7.2 trillion in PPP GDP.
While many envision Europe’s prosperity through the lens of its Western powers, a closer look at Europe’s GDP by region reveals a more detailed regional picture.
IMF economists’ analysis of output in 2025, adjusted for purchasing power parity (PPP), more correctly reflects how different regions of Europe contribute to the continent’s total wealth.
When measured in U.S. dollars, or in nominal terms, Western Europe’s output is certainly impressive and dominant.
Together, the countries of Western Europe, including the UK and France, account for about $11.5 trillion, or 41% of Europe’s total nominal GDP.
Their strong manufacturing base, robust consumer markets and developed trade networks allow the region to lead the continent’s economic hierarchy. Germany alone is on track to reach an economy worth $4.7 trillion in 2025, more than the combined share of Eastern Europe ($4.6 trillion).
But it is GDP in purchasing power parity that shows the real standard of living of the population of each country and region.
And here Western Europe accounts for the largest share of the PPP-adjusted European economy with Int$43.8 trillion in international dollars.
Eastern Europe (Int$12.8 trillion) exceeds both Northern Europe (Int$7.8 trillion) and Southern Europe (Int$8.3 trillion) in PPP terms, helped largely by the Russian economy (Int$7.2 trillion).
However, in nominal US dollar terms, Eastern Europe ranks lowest (S4.6 trillion).
Regional differences point to the changing economic situation in Europe.
Northern Europe, driven by resource-rich Norway and highly productive Sweden, is experiencing population growth above its share, while Southern Europe continues to recover from a decade of sluggish growth.
Meanwhile, several central and southeastern states, including Poland, Romania, and Hungary, have some of the fastest GDP growth rates on the continent, indicating a gradual redistribution of economic opportunities away from the historical center.
So far, these high rates of development have not affected our country in any way. However, we can hope that this is not a country-specific but a regional trend, and that it will spread from Romania to Bulgaria, Moldova and other neighboring countries. There is even a possible trigger: the post-war reconstruction of Ukraine, in which its geographical neighbors will undoubtedly take the most active part.
Economist Galina Shelar commented on the IMF experts’ analysis: “At first glance, it may seem that estimating GDP by purchasing power is simply a propaganda technique. Indeed, during the last two decades GDP at PPP was 2.5-3 times higher than nominal GDP, which is certainly more pleasant from the point of view of PR-economics.
A fair question arises: what, if not for PR purposes, is such (PPP) estimation of GDP needed?
So, PPP (Purchasing Power Parity) is an economic indicator that allows comparing the size of economies and their contribution to the world economy, taking into account the difference in prices for goods and services between countries. The baskets compared include food, housing, transportation, medicine and education (more than 1000 items). In other words, PPP allows currencies to be compared based on the price of the same basket of goods.
For example, in the U.S. a Big Mac costs about $6, while in Moldova a similar hamburger costs 80 lei. Taking into account today’s dollar exchange rate (16.5 lei per $1), Americans pay 100 lei for a product that is a quarter cheaper in Moldova. This is how PPP allows us to compare prices and living standards in Moldova and abroad.
It is quite obvious that the use of PPP GDP ranks countries more accurately, compared to nominal GDP, based on the size of their economies.
Unfortunately, for Moldova, none of the GDP estimates “get rid” of the marker – one of the poorest countries in Europe. Moreover, being higher than Montenegro in both GDP estimates, for example, Moldova is significantly behind this country in terms of GDP per capita: $8.3 thousand in Moldova and $13.5 thousand in Montenegro (nominal GDP) and, respectively, $19.8 thousand and $33.6 thousand, GDP in purchasing power parity”.


